Raw Data
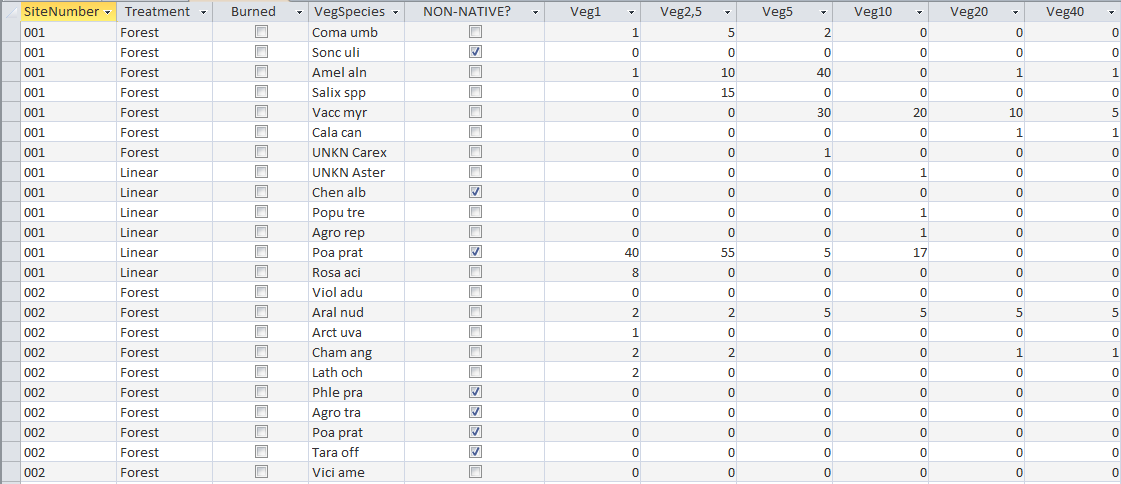
Table 1: A portion of my data set from the summer of 2018. 'VegSpecies' includes that conventionally accepted species codes for any recorded species. There are a few unknown species (UNKN), but there were always identified to at least Genus, and were given consistent names when it was known to be the same species. Provincial databases were used to categorize what species are considered Non-native. 'Veg1 - Veg40' represent the percent covers measured at transect distances of 1, 2.5, 5, 10, 20, and 40m.
|
Table 1 is a sample of my much larger data set, measuring the percent covers of every species along transects in both burned and unburned sites. There were 11 paired sites (intact forest and linear disturbance), both burned and unburned, totaling 5 pairs of unburned sites and 6 pairs of burned sites for 22 transects total. Across the transects, there were 1000s of percent covers recorded for 143 unique plant species. Many of these species had relatively low occurrences, with 48 species appearing along only one transect.
Measures of species presence, qualifiers of native / non-native, and the percent cover of every species along these transects gives us all the data needed to address out main objectives. We can quantify the species richness, observe how these species move along linear disturbances, and compare how this varies across out treatment types. While it may fall outside the scope of this project, there are also opportunities to measure how specific species or genus may behave under the given conditions. And with approximately 1/3rd of the measured species occurring along one transect only, future research could potentially answer similar questions about rare species, that we are currently investigating about non-natives. |
|
